Application Crashes <-
These are common application and daemon liveness issues.
Persistent Store Crashed <-
| Symptom | Cause | Resolution |
|---|---|---|
| umestored process (PID) not running or a core file exists | Contact UM Support |
DRO Crashed <-
| Symptom | Cause | Resolution |
|---|---|---|
| tnwgd process (PID) not running or a core file exists | Contact UM Support |
Excessive Resource Use <-
| Symptom | Cause | Resolution |
|---|---|---|
| Excessive CPU usage, often 100% |
| Check "no-topic-messages" statistic. Check if SI% (time spent processing system interrupts) is high; if so there may be too many contexts interested in the same transport data |
Crash on deletion of an object <-
| Symptom | Cause | Resolution |
|---|---|---|
| Application doesn't shutdown well -or- Application crashes during shutdown or the deletion of an object | Improper object deletion | See LBM Deletion Best Practices |
Datagram size mismatches <-
| Symptom | Cause | Resolution |
|---|---|---|
| Log message: endpoint portal [s] unable to send: datagram size mismatch. transport_XXX_datagram_max_size must be properly configured. | Datagram sizes are inconsistently configured across the system. | Coordinate the maximum datagram size among the following configuration options.
|
Assertions <-
UM produces assertions for conditions that are not expected to occur. They are not error conditions and indicate extenuating conditions that we don't handle or don't expect.
Fatal Assertions <-
Fatal assertions appear for conditions that are not expected to occur and therefore require a shutdown.
Non-fatal Assertions <-
Non-fatal assertions occur for unexpected conditions but do not require shutdown. Normal operation may continue.
Message Loss <-
UM can recover message loss automatically but any recurring loss situation should be investigated and resolved.
Symptom
The receiving application monitoring statistic, lost, reports the number of datagrams detected as lost.
In addition, NAKing activity also indicates message loss, however, you could turn NAKing off. (If you are concerned about message loss, however, you should not turn it off.) Your source application monitoring statistics show values for naks_rcved or nak_pckets_rcved. Receiving application monitoring statistics show values for naks_sent or nak_pckets_sent.
Cause
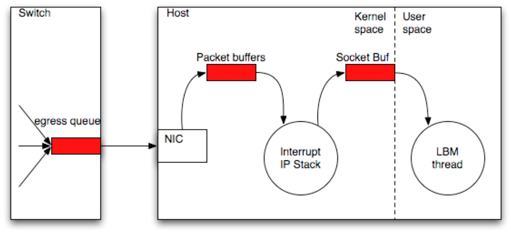
Message loss in source-paced transports (LBT-RM, LBT-RU) can occur due to the following.
- Slow or overloaded receiver applications drop packets because, for example, the CPU can't service network interrupts or UDP socket buffers.
- An overloaded network infrastructure drops packets because of, for example, switch buffer overflows or NIC ring buffer overflows.
- A network component fails.
The following diagram depicts possible locations of message loss.
Resolution
Select the appropriate command from the table below to diagnose UDP socket buffer or NIC ring buffer loss.
| Platform | Buffer | Command | Result |
|---|---|---|---|
| Linux | UDP socket buffer | netstat -s | Look for the UDP field, packet receive errors |
| Linux | NIC ring buffer | ifconfig eth0 | Look for RX packets ... overruns |
| Windows (7 and beyond) | UDP socket buffer | netstat -s | Look for the UDP field, packet receive errors |
| Solaris | UDP socket buffer | kstat | grep udpInOverflows | Look for the UDP field, packet receive errors |
| Solaris | NIC ring buffer | kstat -n bge0 | grep norcvbuf | Look for RX packets ... overruns |
| Network component | — | Refer to the components documentation. | — |
Use the following table if you find loss with any of the above actions.
| If you find loss in | And the loss | Resolution |
|---|---|---|
| UDP socket buffer | occurs in small bursts | Increase the UDP buffer size. |
| UDP socket buffer | Is constant | Escalate the issue to your UM development team. |
| NIC ring buffer | — | Maximize the NIC's receive descriptors. If this doesn't reduce the loss, escalate the issue to your UM development team. |
| A network component | — | Escalate the issue to your network team or UM development team. |
If you do not find loss in any buffers or network components, contact UM Support.
Note: Microsoft Windows prior to version 7 does not report buffer loss accurately. If you believe you are experiencing UDP socket buffer overflows, you can try increasing the UDP buffer size. If you believe you are experiencing NIC ring buffer overflows, contact your NIC vendor for assistance.
Unrecoverable Loss <-
Unrecoverable message loss refers to messages that have not been delivered and are not available for retransmission.
| Symptom | Cause | Resolution |
|---|---|---|
| Monitoring statistics, unrecovered_txw > zero | Unrecovered messages have been removed from the source's transmission and cannot be retransmitted. | Identify the source of the loss using Message Loss. -or- Contact UM Support. |
| Monitoring statistics, unrecovered_tmo > zero | Identify the source of the loss using Message Loss. -or- Contact UM Support. | |
| Unrecovered messages that were not recovered before the NAK generation interval expired. | Application log messages: LBM_MSG_UNRECOVERABLE_LOSS or LBM_MSG_UNRECOVERABLE_LOSS_BURST | Identify the source of the loss using Message Loss. -or- Contact UM Support. |
Either of the two causes mentioned above for unrecovered_txw or unrecovered_tmo.
See also LBT-RM reports unrecoverable loss. What should I do?
High Latency <-
High latency can appear as latency spikes or just slow recovery processes such as Late Join.
| Symptom | Cause | Resolution |
|---|---|---|
| Latency spikes | Two most common causes:
|
If these scenarios are not the problem, contact UM Support. |
| Slow Late Join operation | — | Contact UM Support |
Deaf Receivers <-
Receiver deafness is a general term that means a subscriber is not getting messages, even though the publisher is sending messages. Awareness of this condition can come from many sources, such as business people complaining that they are not receiving expected data or from your own monitoring of statistics, application logs or the liveness of processes.
Use the following table to help detect topic or receiver deafness.
| Symptom | Cause | Resolution |
|---|---|---|
| All transport monitoring statistics stop "ticking". | When statistics for the affected transports stop increasing, it indicates an application has stopped publishing data for some reason. As a result the receivers of that data will go deaf. | Restart the sending applications or contact UM Support |
| LBT-RM or LBT-RU source monitoring statistics, msgs_sent and bytes_sent stop increasing | Indicates a source or sources has gone off-line, resulting in receiver deafness. | Restart the sending applications or contact UM Support |
| LBT-RM or LBT-RU receiver monitoring statistics, msgs_rcvd and bytes_rcvd stop increasing | Indicates a receiver or receivers have gone off-line. | Restart the receiving applications or contact UM Support |
| LBT-RU or TCP source monitoring statistics, num_clients change in unusual ways. | LBT-RU and TCP sources are able to track the number of connected clients. Unusual changes to the number of connected LBT-RU or TCP clients can indicate a problem. For example, clients dropping off during trading hours, or rapid changes in the number of clients. | Restart the sending and/or receiving applications or contact UM Support |
| End of Session (EOS) messages appear in applications logs. | When activity intervals expire, UM issues EOS messages to receiving applications. These appear in the application logs. | Restart the receiving applications or contact UM Support |
| The lbmrd Process ID (PID) disappears on either a sending or receiving machine(s). | Topic resolution has stopped. May not result in immediate topic deafness if topic resolution has already been completed, but may result in deafness if a new source or receiver comes up. | If the receiving context's monitoring statistic tr_rcv_unresolved_topics is zero, all topics are resolved and this may not be a problem. Either restart the receiving applications or contact UM Support |
Deaf Receivers with the UM Gateway
After a receiver-side gateway is shutdown and restarted, receivers will be deaf to any forwarded traffic until EOS is triggered.
Deaf Wildcard Receivers
| Symptom | Cause | Resolution |
| Wildcard receivers are not receiving messages. | — |
|
Persistent Sending Problems <-
UM sources sending from a persistence application can encounter problems with flight size or the persistent store.
Flight Size <-
A blocked source due to flight size limitations is not a visible problem unless the operator can see all data flows through the system.
| Symptom | Cause | Resolution |
|---|---|---|
| Monitoring statistics show a lower level of activity for a Persistence application than expected. | Source not sending because it is blocked by flight size |
|
Persistent Store Connectivity <-
| Symptom | Cause | Resolution |
| Store log contains message, LBM_SRC_EVENT_UME_STORE_ UNRESPONSIVE | Unresponsive store | The receiver can track the inability to complete registration by correlating the receipt of a new source notification with a LBM_MSG_UME_REGISTRATION_COMPLETE_EX event. The new source notification is defined by the option receiver resolver_source_notification_function (context). A timer should be set to log a message or trigger an alarm if the completion message is not received after multiple seconds. To match the source in the callback to the completion event, a string comparison should be used on the lbm_msg->source field. The timer for each source should be canceled when its registration complete event is received. |
The source can detect a loss of quorum by checking the error string passed in for the event LBM_SRC_EVENT_UME_STORE_UNRESPONSIVE. The string will contain "(quorum lost)". | Lost quorum (EUMENOREG) | Restart the affected persistent Stores. |