6. Monitoring UMS
6.1. Introduction
Messaging systems often employ real-time monitoring and rapid human intervention to prevent the system from becoming unstable. The design of UM encourages stable operation by allowing you to pre-configure how UM will use resources under all traffic and network conditions. Hence manual intervention is not required when those conditions occur.
Monitoring UM still fills important roles other than maintaining stable operation. Chiefly among these are capacity planning and a better understanding of the latency added by UM as it recovers from loss. Collecting accumulated statistics from all sources and all receivers once per day is generally adequate for these purposes.
6.1.1. Why Monitor?
Monitoring can aid different groups within an organization.
-
Developers can spot bugs that impact system performance.
-
Performance tuning groups can pinpoint under-performing receivers.
-
Testing groups can understand the reaction of a system to stresses like random packet loss during pre-production testing.
-
Network or middleware management groups can use monitoring to ensure a production system continues to operate within its design criteria.
6.1.2. What to Monitor
Before discussing the monitoring statistics that are built into UM, we mention two things that are probably more important to monitor: connectivity and latency. UM provides some assistance for monitoring these, but the final responsibility rests with your applications.
6.1.2.1. Connectivity
If you monitor only one thing, monitor connectivity, defined as the ability of your system components to talk to each other when needed Connectivity failures generally indicate a software, hardware, or network failure and generally require prompt attention. UM features like End Of Source (EOS) events, new source notifications, and receiver connect/disconnect events may help in application connectivity monitoring. See the lbmprice.c example to see techniques for using these to build an awareness of when components of the system come and go.
6.1.2.2. Message Latency
If you monitor only two things, monitor connectivity and the latency of every message. Connectivity monitoring will catch the hard failures and latency monitoring will catch the soft failures. Many impending hard failures in hardware, software, and networks show up first as rises in average latency or as latency spikes. See our white paper Pragmatic Advice for Handling Market Data Rate Increases for additional comments on the importance of measuring latency.
6.1.2.3. Monitoring Methods
UM provides the following four methods to monitor your UM activities.
-
Use UM API function calls within your applications to retrieve statistics and deliver them to your monitoring application.
-
Use the UM Monitoring API to more easily retrieve and send statistics to your monitoring application.
-
Use Automatic Monitoring to easily employ the UM Monitoring API to monitor UM activity at an UM context level.
-
Use the Ultra Messaging® SNMP Agent and MIB to monitor statistics through a Network Management System. The Ultra Messaging SNMP Agent is purchased separately.
6.2. UMS API Functions and Data Structures
The UM API contains functions that retrieve various statistics for a context, event queue, source or receiver. This section lists the functions and constructors you can use to retrieve statistics, along with the data structures UM uses to deliver the statistics. Refer to the UMS API documentation ( UM C API, UM Java API or UM .NET API) for specific information about the functions and constructors. Links to the data structures appear in the tables to provide quick access to the specific statistics available.
6.2.1. Context Statistics
Context statistics help you monitor topic resolution activity, along with the number of unknown messages received and the number of sends and responses that were blocked or returned EWOULDBLOCK. Context statistics also contain transport statistics for Multicast Immediate Messaging (MIM) activity and transport statistics for all the sources or receivers in a context.
| C API Function | Java or .NET API Constructor | Data Structure |
|---|---|---|
| lbm_context_retrieve_stats() | LBMContextStatistics(LBMContext ctx) | lbm_context_stats_t |
| lbm_context_retrieve_rcv_transport_stats() | LBMReceiverStatistics(LBMContext int maxStats) | lbm_rcv_transport_stats_t |
| lbm_context_retrieve_src_transport_stats() | LBMSourceStatistics(LBMContext int maxStats) | lbm_src_transport_stats_t |
| lbm_context_retrieve_mim_rcv_stats() | LBMMIMReceiverStatistics(LBMContext ctx) | lbm_rcv_transport_stats_lbtrm_t |
| lbm_context_retrieve_mim_src_stats() | LBMMIMSourceStatistics(LBMContext ctx) | lbm_src_transport_stats_lbtrm_t |
6.2.2. Event Queue Statistics
Event Queue statistics help you monitor the number of events currently on the queue, how long it takes to service them (maximum, minimum and mean service times) and the total number of events for the monitoring period. These statistics are available for the following types of events.
-
Data messages
-
Request messages
-
Immediate messages
-
Wildcard receiver messages
-
I/O events
-
Timer events
-
Source events
-
Unblock events
-
Cancel events
-
Callback events
-
Context source events
-
Total events
-
Age of events
When monitoring Event Queue statistics you must enable the Event Queue UM Configuration Options, queue_age_enabled, queue_count_enabled and queue_service_time_enabled . UM disables these options by default, which produces no event queue statistics.
| C API Function | Java or .NET API Constructor | Data Structure |
|---|---|---|
| lbm_event_queue_retrieve_stats() | LBMEventQueueStatistics(LBMEventQueue evq) | lbm_event_queue_stats_t |
6.2.3. Transport Statistics
You can retrieve transport statistics for different types of transports (TCP, LBT-RU, LBT-RM, LBT-IPC, LBT-RDMA). In addition, you can limit these transport statistics to a specifc source sending on the particular transport or a specifc receiver receiving messages over the transport. Source statistics for LBT-RM, for example, include the number of messages (datagrams) sent and the number of retransmissions sent. For receiver LBT-RM, statistics include, for example, the number of messages (datagrams) received and number of UM messages received.
Note: None of the three types of transport statistics (all, source, or receiver) are topic level statistics. Currently UM does not provide topic-specific transport statistics.
| C API Function | Java or .NET API Constructor | Data Structure |
|---|---|---|
| lbm_rcv_retrieve_transport_stats() | LBMReceiverStatistics(LBMReceiver lbmrcv source) | lbm_rcv_transport_stats_t |
| lbm_rcv_retrieve_all_transport_stats() | LBMReceiverStatistics(LBMReceiver lbmrcv int maxStats) | lbm_rcv_transport_stats_t |
| lbm_src_retrieve_transport_stats() | LBMSourceStatistics(LBMSource lbmsrc) | lbm_src_transport_stats_t |
6.3. UMS Monitoring API
This section discusses the following topics.
The UM Monitoring API (see lbmmon.h or the LBMMonitor classes in the Java API and the .NET API) provides a framework to easily gather UMS transport statistics and send them to a monitoring or reporting application. Transport sessions for sources and receivers, along with all transport sessions for a given context can be monitored. This API can be implemented in one of two ways.
-
Build monitoring into your application with the UM Monitoring API functions.
-
Turn on Automatic Monitoring with UMS configuration options. See Automatic Monitoring.
An application requesting transport monitoring is called a monitor source, and an application accepting statistics is a monitor receiver. These monitoring objects deal only with transport session statistics and should not be confused with UM sources and UM receivers, which deal with UM messages. Statistics for both UM sources and UM receivers can be forwarded by a monitor source application.
Both a monitor source and monitor receiver comprise three modules:
-
A format module, responsible for serializing and de-serializing the statistics. The proper transmission between monitor source and monitor receiver requires this serialization.
-
A transport module that is responsible for sending and receiving statistics data.
-
A control module, responsible for gathering the statistics, and calling the appropriate functions from the format and transport modules.
You can substitute format and transport modules of your own choosing or creation. UM Monitoring provides the following sample modules:
-
LBMMON CSV format module
-
LBMMON UMS transport module
-
LBMMON UDP transport module
-
LBMMON SNMP transport module
To view the source code for all LBMMON transport modules, see LBMMON Example Source Code found on the Related Pages tab in the C Application Programmer's Interface.
Note: The LBMMON SNMP transport module can be used for non-SNMP based monitoring. The Ultra Messaging SNMP Agent is not required for its use.
6.3.1. UMS Monitoring Process Flow
The overall process flow appears in the diagram below.
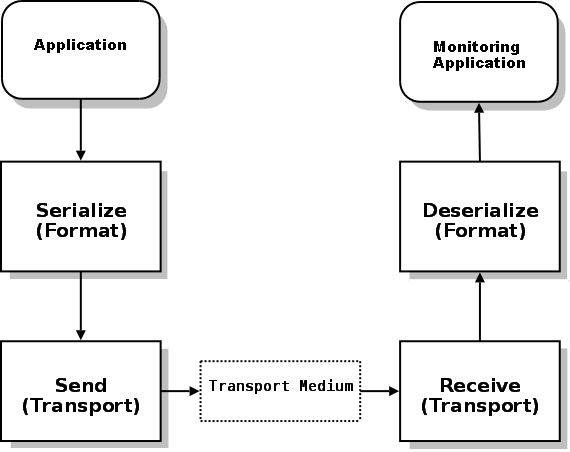
-
Your application creates the monitor source controller, specifying the format and transport modules to use. It also calls lbmmon functions to start monitoring an UM context, UM source or UM receiver.
-
The monitor source controller passes those statistics to the format module serialization function.
-
The monitor source controller passes the resulting serialized data to the transport module send function.
-
The transport module transmits the data over some transport medium (such as a network).
-
The monitor receiver controller transport module receives the serialized data. (Your monitoring application has already created the monitor receiver controller specifying the format and transport modules to use, along with the application callback functions to use upon the receipt of UM source or UM receiver statistics data.)
-
The monitor receiver controller calls the format module's de-serialization function.
-
Finally, the monitor receiver controller passes the statistics to your monitoring application via the specified application callback functions.
Your applications only calls functions in the controller modules, which calls the appropriate functions in the transport and format modules.
6.3.2. API Framework Flexibility
The segregation of UM Monitoring into control, format, and transport modules provides flexibility for monitor receivers in two ways.
-
Allows you to use languages for which no UM API or binding exists.
-
Allows you to use monitoring products which do not integrate with UM.
As an example, assume you have a Perl application which currently gathers statistics from other network applications (or, you are simply most comfortable working in Perl for such tasks). There is no Perl binding for UM. However, Perl can handle UDP packets very nicely, and can pick apart CSV data easily. By implementing a UDP transport module to be used by the monitor sources, your Perl application can read the UDP packets and process the statistics.
6.3.3. Initial Monitoring Questions
If you can answer the following questions, you're already on your way.
-
What format module will you use? LBMMON CSV Format module or a different one.
-
What transport module will you use? One of the 3 LBMMON modules or a different one.
-
Do you want to monitor individual sources/receivers, or an entire context? The difference is in how the statistics are aggregated.
-
Monitoring a context aggregates transport statistics for all sources and receivers associated with a context, by transport. Note that this is not by transport type. The default configuration for TCP, for example, allocates up to 10 ports, forming up to 10 separate transport sessions. Absent any specific instructions, UM allocates sources and receivers to these 10 transports in a round-robin fashion. So the statistics for a specific transport on a context will aggregate all sources and receivers which use that specific transport.
-
Ultra Messaging recommends that you monitor either a context or source/receiver, but not both. For example if Topic1 and Topic2 are mapped to the same transport session (which is the only transport session for the context) and you monitor both the receivers and the context, you will get 3 identical sets of statistics: one for Topic1 reporting the stats for it's transport session, one for Topic2 reporting the stats for the same transport session, and one for the transport session via the context.
-
In the case of wildcard receivers, only the context may be monitored. UM creates wildcard receivers dynamically as it detects topics which match the wildcard pattern. The application does not have access to these dynamically-created receivers. So the only way to monitor a wildcard receiver is to monitor the context on which it was created.
-
-
Should statistics be sent automatically, or on demand?
-
Automatic sending of statistics is by far the simplest approach. You simply indicate how often the statistics should be gathered and sent. The rest is taken care of.
-
On-demand is somewhat more involved. Your application decides when statistics should be gathered and sent. If you intend to use the arrival of statistics as a type of heartbeat, this is the method you should use.
-
The following sections present more discussion and sample source code about starting monitor sources, monitor receivers and the LBMMON format and transport modules.
6.3.4. Creating a Monitoring Source
The following examples demonstrate how to use the UM Monitoring API to enable monitoring in your application.
First, create a monitoring source controller:
lbm_context_t * ctx;
lbm_src_t * src;
lbm_rcv_t * rcv;
lbmmon_sctl_t * monctl;

if (lbmmon_sctl_create(&monctl, lbmmon_format_csv_module(), NULL, lbmmon_transport_lbm_module(), NULL) == -1)
{
        fprintf(stderr, "lbmmon_sctl_create() failed\n");
        exit(1);
}
The above code tacitly assumes that the ctx, src, and rcv variables have been previously assigned via the appropriate UM API calls.
The monitoring source controller object must be passed to subsequent calls to reference a specific source controller. One implication of this is that it is possible to have multiple monitoring source controllers within a single application, each perhaps monitoring a different set of objects.
In the above example, the default CSV format module and default UM transport module are specified via the provided module functions lbmmon_format_csv_module() and lbmmon_transport_lbm_module().
6.3.5. Specifying the Object to Monitor
Once a monitoring source controller is created, the application can monitor a specific context using:
if (lbmmon_context_monitor(monctl, ctx, NULL, 10) == -1)
{
        fprintf(stderr, "lbmmon_context_monitor() failed\n");
        exit(1);
}
The above example indicates that statistics for all transports on the specified context will be gathered and sent every 10 seconds.
A UM source can be monitored using:
if (lbmmon_src_monitor(monctl, src, NULL, 10) == -1)
{
        fprintf(stderr, "lbmmon_src_monitor() failed\n");
        exit(1);
}
Finally, an UM receiver can be monitored using:
if (lbmmon_rcv_monitor(monctl, rcv, NULL, 10) == -1)
{
        fprintf(stderr, "lbmmon_rcv_monitor() failed\n");
        exit(1);
}
The two above examples also request that statistics for all transports on the specified source or receiver be gathered and sent every 10 seconds.
Statistics can also be gathered and sent in an on-demand manner. Passing 0 for the Seconds parameter to lbmmon_context_monitor(), lbmmon_src_monitor(), or lbmmon_rcv_monitor() prevents the automatic gathering and sending of statistics. To trigger the gather/send process, use:
lbmmon_sctl_sample(monctl);
Such a call will perform a single gather/send action on all monitored objects (contexts, sources, and receivers) which were registered as on-demand.
As part of application cleanup, the created monitoring objects should be destroyed. Each individual object can be de-registered using lbmmon_context_unmonitor(), lbmmon_src_unmonitor(), or lbmmon_rcv_unmonitor(). Finally, the monitoring source controller can be destroyed using:
lbmmon_sctl_destroy(monctl);
Any objects which are still registered will be automatically de-registered by lbmmon_sctl_destroy().
6.3.6. Receiving Monitoring Data
To make use of the statistics, an application must be running which receives the monitor data. This application creates a monitoring receive controller, and specifies callback functions which are called upon the receipt of source or receiver statistics data.
Use the following to create a monitoring receive controller:
lbmmon_rctl_t * monctl;
lbmmon_rctl_attr_t * attr;
lbmmon_rcv_statistics_func_t rcvcb = { rcv_statistics_cb };
lbmmon_src_statistics_func_t srccb = { src_statistics_cb };
lbmmon_evq_statistics_func_t evqcb = { evq_statistics_cb };
lbmmon_ctx_statistics_func_t ctxcb = { ctx_statistics_cb };

if (lbmmon_rctl_attr_create(&attr) != 0)
{
    fprintf(stderr, "call to lbmmon_rctl_attr_create() failed, %s\n", lbmmon_errmsg());
    exit(1);
}
if (lbmmon_rctl_attr_setopt(attr, LBMMON_RCTL_RECEIVER_CALLBACK, (void *) &rcvcb, sizeof(rcvcb)) != 0)
{
    fprintf(stderr, "call to lbmmon_rctl_attr_setopt() failed, %s\n", lbmmon_errmsg());
    exit(1);
}
if (lbmmon_rctl_attr_setopt(attr, LBMMON_RCTL_SOURCE_CALLBACK, (void *) &srccb, sizeof(srccb)) != 0)
{
    fprintf(stderr, "call to lbmmon_rctl_attr_setopt() failed, %s\n", lbmmon_errmsg());
    exit(1);
}
if (lbmmon_rctl_attr_setopt(attr, LBMMON_RCTL_EVENT_QUEUE_CALLBACK, (void *) &evqcb, sizeof(evqcb)) != 0)
{
    fprintf(stderr, "call to lbmmon_rctl_attr_setopt() failed, %s\n", lbmmon_errmsg());
    exit(1);
}
if (lbmmon_rctl_attr_setopt(attr, LBMMON_RCTL_CONTEXT_CALLBACK, (void *) &sctxcb, sizeof(ctxcb)) != 0)
{
    fprintf(stderr, "call to lbmmon_rctl_attr_setopt() failed, %s\n", lbmmon_errmsg());
    exit(1);
}
if (lbmmon_rctl_create(&monctl, lbmmon_format_csv_module(), NULL, lbmmon_transport_lbm_module(), (void *)
transport_options, attr) != 0)
{
    fprintf(stderr, "call to lbmmon_rctl_create() failed, %s\n", lbmmon_errmsg());
    exit(1);
}
if (lbmmon_rctl_attr_delete(attr) != 0)
{
    fprintf(stderr, "call to lbmmon_rctl_attr_delete() failed, %s\n", lbmmon_errmsg());
    exit(1);
}
As in the earlier example, the default CSV format module and default UM transport module are specified via the provided module functions lbmmon_format_csv_module() and lbmmon_transport_lbm_module().
As an example of minimal callback functions, consider the following example:
void rcv_statistics_cb(const void * AttributeBlock, const lbm_rcv_transport_stats_t * Statistics)
{
    lbm_ulong_t source = LBMMON_ATTR_SOURCE_NORMAL;
    if (lbmmon_attr_get_source(AttributeBlock, &source) != 0)
    {
        source = LBMMON_ATTR_SOURCE_NORMAL;
    }
    switch (Statistics->type)
    {
        case LBM_TRANSPORT_STAT_TCP:
            handle_rcv_tcp_statistics();
            break;
        case LBM_TRANSPORT_STAT_LBTRM:
            switch (source)
            {
                case LBMMON_ATTR_SOURCE_IM:
                    handle_rcv_im_lbtrm_statistics();
                    break;
                default:
                    handle_rcv_lbtrm_statistics();
                    break;
            }
            break;
        case LBM_TRANSPORT_STAT_LBTRU:
            handle_rcv_lbtru_statistics();
            break;
    }
}

void src_statistics_cb(const void * AttributeBlock, const lbm_src_transport_stats_t * Statistics)
{
    lbm_ulong_t source = LBMMON_ATTR_SOURCE_NORMAL;
    if (lbmmon_attr_get_source(AttributeBlock, &source) != 0)
    {
        source = LBMMON_ATTR_SOURCE_NORMAL;
    }
    switch (Statistics->type)
    {
        case LBM_TRANSPORT_STAT_TCP:
            handle_src_tcp_statistics();
            break;
        case LBM_TRANSPORT_STAT_LBTRM:
            switch (source)
            {
                case LBMMON_ATTR_SOURCE_IM:
                    handle_src_im_lbtrm_statistics();
                    break;
                default:
                    handle_src_lbtrm_statistics();
                    break;
            }
            break;
        case LBM_TRANSPORT_STAT_LBTRU:
            handle_src_lbtru_statistics();
            break;
    }
}

void ctx_statistics_cb(const void * AttributeBlock, const lbm_context_stats_t * Statistics)
{
    /* Handle context stats */
}

void evq_statistics_cb(const void * AttributeBlock, const lbm_event_queue_stats_t * Statistics)
{
    /* Handle event queue stats */
}
Upon receipt of a statistics message, the appropriate callback function is called. The application can then do whatever is desired with the statistics data, which might include writing it to a file or database, performing calculations, or whatever is appropriate.
Beyond the actual statistics, several additional pieces of data are sent with each statistics packet. These data are stored in an attribute block, and are accessible via the lbmmon_attr_get_*() functions. Currently, these data include the IPV4 address of machine which sent the statistics data, the timestamp (as a time_t) at which the statistics were generated, and the application ID string supplied by the sending application at the time the object was registered for monitoring. See lbmmon_attr_get_ipv4sender(), lbmmon_attr_get_timestamp(), and lbmmon_attr_get_appsourceid() for more information.
6.3.7. The UMS Transport Module
The UM transport module understands several options which may be used to customize your use of the module. The options are passed via the TransportOptions parameter to the lbmmon_sctl_create() and lbmmon_rctl_create() functions, as a null-terminated string containing semicolon-separated name/value pairs.
The following options are available:
-
config specifies a configuration file. This file is processed in a manner similar to lbm_config(). However, unlike lbm_config(), the current default attributes are not changed. Instead, the options parsed from the configuration file are applied only to the UM objects created by the module.
-
topic specifies the topic name to use for sending and receiving statistics. By default, the topic /29west/statistics is used.
-
wctopic specifies (for monitor receivers only) a wildcard pattern to be used to receive statistics.
As an example, assume your application needs to use a special configuration file for statistics. The following call allows your application to customize the UM transport module using the configuration file stats.cfg.
lbmmon_sctl_t * monctl;
const char * tropt = "config=stats.cfg";
if (lbmmon_sctl_create(&smp;monctl, lbmmon_format_csv_module(), NULL,
lbmmon_transport_lbm_module(), tropt) == -1)
{
        fprintf(stderr, "lbmmon_sctl_create() failed\n");
        exit(1);
}
If your application also needs to use a specific topic for statistics, the following code specifies that, in addition to the configuration file, the topic StatisticsTopic be used for statistics.
lbmmon_sctl_t * monctl;
const char * tropt = "config=stats.cfg;topic=StatisticsTopic";
if (lbmmon_sctl_create(&monctl, lbmmon_format_csv_module(), NULL, lbmmon_transport_lbm_module(),
tropt) == -1)
{
        fprintf(stderr, "lbmmon_sctl_create() failed\n");
        exit(1);
}
It is important to use the same topic and configuration for both monitor sources and receivers. Otherwise your applications may send the statistics, but the monitor receiver won't be able to receive them.
To view the source code for all LBMMON transport modules, see LBMMON Example Source Code found on the Related Pages tab in the C Application Programmer's Interface.
6.3.8. The UDP Transport Module
The UDP transport module understands several options which may be used to customize
your use of the module. The options are passed via the TransportOptions parameter to the lbmmon_sctl_create() and lbmmon_rctl_create() functions, as a null-terminated string
containing semicolon-separated name/value pairs.
The UDP module supports sending and receiving via UDP unicast, UDP broadcast, and UDP multicast. The following options are available.
-
address specifies the unicast IP address to which statistics are sent via UDP. Applicable to sender only.
-
port is the IP port packets are sent to. Defaults to 2933.
-
interface specifies the network interface over which multicast UDP is sent or received.
-
mcgroup is the multicast group on which to send and receive UDP packets.
-
bcaddress specified the broadcast address to which UDP packets are sent. Applicable to sender only.
-
ttl specifies the TTL for each multicast UDP packet. Applicable to sender only.
To view the source code for all LBMMON transport modules, see LBMMON Example Source Code found on the Related Pages tab in the C Application Programmer's Interface.
6.3.9. The SNMP Transport Module
The SNMP transport modules operates in identical fashion to the UMS Transport Module. See The UMS Transport Module
To view the source code for all LBMMON transport modules, see LBMMON Example Source Code found on the Related Pages tab in the C Application Programmer's Interface.
6.4. Automatic Monitoring
Instead of building a monitoring capability into your application using the UM Monitoring API, automatic monitoring allows you to easily produce monitoring statistics with the UM Monitoring API by setting a few simple UM configuration options. Automatic monitoring does not require any changes to your application. You control Automatic Monitoring with eight Automatic Monitoring Options.
You can enable Automatic Monitoring for either or both of the following.
-
Transport Statistics - Automatic monitoring of transport statistics reflect data for all the transport sessions within the UM context. You cannot, however, receive statistics for an individual transport session. Essentially, you turn on automatic monitoring of a context's transport sessions by specifying a context monitor_interval. The use of the Ultra Messaging SNMP Agent requires the lbmsnmp monitor_transport.
-
Event Queue Statistics - Automatic Monitoring of Event Queues provides statistics for all the Event Queues within the UM context. You turn on automatic monitoring of a context's Event Queues by specifying a event_queue monitor_interval.
You can also set environment variables to turn on automatic monitoring for all UM contexts (transports and event queues). See Automatic Monitoring Options for more information.
6.5. Monitoring Examples
This section demonstrates the use of the two UM monitoring example applications described in /doc/example/index.html. We present advice based on what we have seen productively monitored by customers and our own knowledge of transport statistics that might be of interest. Of course, what you choose to monitor depends on your needs so merge these thoughts with your own needs to determine what is best for you.
6.5.1. lbmmon.c
The example application lbmmon.c acts as a Monitor Receiver and is provided in both executable and source form. It writes monitoring statistics to the screen and can be used in conjunction with other example applications (which act as the Monitor Sources). The following procedure uses lbmrcv and lbmsrc to create messaging traffic and adds a configuration file in order to specify the LBT-RM transport instead of the TCP default. (The LBT-RM transport displays more statistics than TCP.)
Since UM does not generate monitoring statistics by default, you must activate monitoring in your application. For the example application, use the --monitor-ctx=n option where n is the number of seconds between reports. The following procedure activates monitoring on the receiver, specifying the context (ctx) to create a complete set of receiver statistics. You could activate monitoring in a similar fashion on the source and create source statistics.
To use lbmmon to view statistics from sample application output:
-
Create configuration file with the single option of source transport lbtrm and name it LBTRM.cfg.
-
Run lbmmon --transport-opts="config=LBTRM.cfg"
-
Run lbmrcv -c LBTRM.cfg --monitor-ctx=5 Arizona
-
Run lbmsrc -c LBTRM.cfg Arizona
After lbmsrc completes, the final output for lbmmon should closely resemble the following.
Receiver statistics received from C:\Program Files\29West\UME_1.2.1\Win2k-i386\bin\lbmrcv.exe
at 10.29.1.78, sent Wed Jan 09 14:25:49 2008
Source: LBTRM:10.29.1.78:4391:323382d8:224.10.10.10:4400
Transport: LBT-RM
LBT-RM messages received                                 : 45455
Bytes received                                           : 370000000
LBT-RM NAK packets sent                                  : 0
LBT-RM NAKs sent                                         : 0
Lost LBT-RM messages detected                            : 0
NCFs received (ignored)                                  : 0
NCFs received (shed)                                     : 0
NCFs received (retransmit delay)                         : 0
NCFs received (unknown)                                  : 0
Loss recovery minimum time                               : 4294967295ms
Loss recovery mean time                                  : 0ms
Loss recovery maximum time                               : 0ms
Minimum transmissions per individual NAK                 : 4294967295
Mean transmissions per individual NAK                    : 0
Maximum transmissions per individual NAK                 : 0
Duplicate LBT-RM data messages received                  : 0
LBT-RM messages unrecoverable (window advance)           : 0
LBT-RM messages unrecoverable (NAK generation expiration): 0
LBT-RM LBM messages received                             : 10000000
LBT-RM LBM messages received with no topic               : 0
LBT-RM LBM requests received                             : 0
Notes:
-
Since this procedure was done on a single machine. No packets were lost and therefore lbmrcv did not generate any NAKs and lbmsrc did not send any NCFs. If you run this procedure across a network, packets may be lost and you would see statistics for NAKs, NCFs and loss recovery.
-
This procedure activates monitoring on the receiver, specifying the context (--monitor-ctx) to create a complete set of receiver transport statistics. You could activate monitoring in a similar fashion on the source and create source statistics. Each set of statistics shows one side of the transmission. For example, source statistics contain information about NAKs received by the source (ignored, shed, retransmit delay, etc.) where receiver statistics contain data about NCFs received. Each view can be helpful.
-
Moreover, as explained earlier in Specifying the Object to Monitor, individual receivers or sources can be monitored instead of all transport activity for a context. For this procedure, use --monitor-rcv or --monitor-src.
-
You could run this procedure again specifying a different transport (LBT-RU or TCP) in the configuration file and receive a different set of statistics. For descriptions of all the transport statistics, refer to the transport statistics data structures in the C Application Programmer's Interface. Click on the Data Structures tab at the top and click on lbm_rcv_transport_stats_t or lbm_src_transport_stats_t.
6.5.2. lbmmonudp.c and lbmmondiag.pl
The example application, lbmmonudp.c receives UM statistics and forwards them as CSV data over a UDP transport. The Perl script, lbmmondiag.pl, can read UDP packets and process the statistics, reporting Severity 1 and Severity 2 events. This script only reports on LBT-RM transports.
To run lbmmonudp.c with lbmmondiag.pl, use the following procedure.
-
Create configuration file with the single option of source transport lbtrm and name it LBTRM.cfg.
-
Run lbmmonudp -a 127.0.0.1 --transport-opts="config=LBTRM.cfg"
-
Run lbmrcv -c LBTRM.cfg --monitor-ctx=5 Arizona
-
Run lbmsrc -c LBTRM.cfg Arizona
-
Run lbmmondiag.pl
The following sections discuss some of the possible results of this procedure. Your results will vary depending upon conditions in your network or if you run the procedure on a single machine.
6.5.2.1. Severity 1 -- Monitoring Unrecoverable Loss
The most severe system problems are often due to unrecoverable datagram loss at the reliable transport level. These are reported as severity 1 events by the lbmmondiag.pl example script. Many of the scalability and latency benefits of UM come from the use of reliable transport protocols like LBT-RM and LBT-RU. These protocols provide loss detection, retransmission, and recovery up to the limits specified by an application. Unrecoverable loss is reported by the transport when loss repair is impossible within the specified limits.
Unrecoverable transport loss often (but not always) leads to unrecoverable message loss so it is very significant to applications that benefit from lossless message delivery.
Unrecoverable loss can be declared by receivers when the transport_lbtrm_nak_generation_interval
has ended without receipt of repair. Each such loss event is recorded by incrementing the
unrecovered_tmo field in lbm_rcv_transport_stats_t. Output from lbmmondiag.pl might look like this:
Sev1: 34 datagrams unrecovered due to NAK generation interval ending
Unrecoverable loss can also be triggered at receivers by notice from a source that the lost datagram has passed out of the source's transmission window. Each such loss event is recorded by incrementing the unrecovered_txw field in lbm_rcv_transport_stats_t. Output from lbmmondiag.pl might look like this:
Sev1: 249 datagrams unrecovered due to transmission window advancement
6.5.2.2. Severity 2 -- Monitoring Rate Controller Activity
The data and retransmission rate controllers built into LBT-RM provide for stable operation under all traffic conditions. These rate controllers introduce some latency at the source since that is generally preferable to the alternative of NAK storms or other unstable states. The lbmmondiag.pl example script reports this activity as a severity 2 event since latency is normally the only effect of their operation.
Activity of the rate controller indicates that a source tried to send faster than the
configured transport_lbtrm_data_rate_limit.
Normally, this limit is set to the speed of the fastest receivers. Sending faster than
this rate would induce loss in all receivers so it is generally best to add latency at
the source or avoid sending in such situations.
The current number of datagrams queued by the rate controller is given in the rctlr_data_msgs field in lbm_src_transport_stats_t. No more than 10 datagrams are ever queued. Output from lbmmondiag.pl might look like this:
Sev2: 10 datagrams queued by data rate controller
Activity of the retransmission rate controller indicates that receivers have requested
retransmissions in excess of the configured transport_lbtrm_retransmit_rate_limit.
Latency is added to retransmission requests in excess of the limit to control the amount
of latency they may add to messages being sent the first time. This behavior avoids NAK
storms.
The current number of datagrams queued by the retransmission rate controller is given in the rctlr_rx_msgs field in lbm_src_transport_stats_t. No more than 101 datagrams are ever queued. Output from lbmmondiag.pl might look like this:
Sev2: 101 datagrams queued by retransmission rate controller
6.5.2.3. Severity 2 -- Monitoring Loss Recovery Activity for a Receiver
It is important to monitor loss recovery activity because it always adds latency if the loss is successfully repaired. UM defaults generally provide for quite a bit of loss recovery activity before loss would become unrecoverable. Statistics on such activity are maintained at both the source and receiver. Unrecoverable loss will normally be preceded by a burst of such activity.
UM receivers measure the amount of time required to repair each loss detected. For each transport session, an exponentially weighted moving average is computed from repair times and the maximum and minimum times are tracked.
The total number of losses detected appears in the lost field in lbm_rcv_transport_stats_t. It may be multiplied by the average repair time given in the nak_stm_mean field in lbm_rcv_transport_stats_t to estimate of the amount of latency that was added to repair loss. This is probably the single most important metric to track for those interested in minimizing repair latency. The lbmmondiag.pl script reports this whenever the lost field changes and the average repair time is nonzero. Output might look like this:
    Sev2: 310 datagrams lost
     Sev2: 112.236 seconds estimated total latency due to repair of 564 losses
Note: This estimate only includes latency added in the recovery of lost messages. Requiring ordered delivery also adds latency for all messages that arrive after the time of loss and before the time that repair arrives. See the
ordered_deliveryoption to control this.
In addition to counting losses detected, UM reliable receivers also count the number of NAKs generated in the naks_sent field in lbm_rcv_transport_stats_t. Output from lbmmondiag.pl might look like this:
Sev2: 58 NAKs sent
Those who are new to reliable multicast protocols are sometimes surprised to learn that losses detected do not always lead to NAK generation. If a datagram is lost in the network close to the source, it is common for many receivers to detect loss simultaneously when a datagram following the loss arrives. Scalability would suffer if all receivers that detected loss reported it by generating a NAK at the same time. To improve scalability, a random delay is added to NAK generation at each receiver. Since retransmissions are multicast, often only one NAK is generated to repair the loss for all receivers. Thus it is common for the number of losses detected to be much larger than the number of NAKs sent, especially when there are many receivers with similar loss patterns.
6.5.2.4. Severity 2 -- Monitoring Loss Recovery Activity for a Source
For sources, the principal concern is often understanding how much the retransmission of messages already sent at least once slowed down the source. Obviously, bandwidth and CPU time spent servicing retransmission requests cannot be used to send new messages. This is the way that lossy receivers add latency for lossless receivers.
UM sources track the number of NAKs received in the naks_rcved field in lbm_src_transport_stats_t. The number of datagrams that they retransmit to repair loss is recorded in the rxs_sent field in lbm_src_transport_stats_t.
The number of retransmitted datagrams may be multiplied by the average datagram size and divided by the wire speed to estimate the amount of latency added to new messages by retransmission. Output from the example lbmmondiag.pl script might look like this:
    Sev2: 7478 NAKs received
     Sev2: 50 retransmissions sent
     Sev2: 0.015056 seconds estimated total latency due to retransmissions
6.6. Interpreting LBT-RM Source Statistics
LBT-RM sources maintain many statistics that can be useful in diagnosing reliable
multicast problems. See the UM API documentation lbm_src_transport_stats_lbtrm_t Structure Reference for a
description of the fields. The remainder of this section gives advice on interpreting the
statistics.
Divide naks_rcved by msgs_sent to find the likelihood that sending a message resulted
in a NAK being received. Expect no more than a few percent on a network with reasonable
loss levels.
Divide rxs_sent by msgs_sent to find the ratio of retransmissions to new data. Many
NAKs arriving at a source will cause many retransmissions.
Divide naks_shed by naks_rcved to find the likelihood that excessive NAKs were
ignored. Consider reducing loss to avoid NAK generation.
Divide naks_rcved by nak_pckts_rcved to find the likelihood that NAKs arrived
individually (~1 -> individual NAKs likely; ~0 -> NAKs likely
to have arrived grouped in a single packet). Individual NAKs often indicate sporadic loss
while grouped NAKs often indicate burst loss.
Divide naks_rx_delay_ignored by naks_ignored to find the likelihood that NAKs arrived during the
ignore interval following a retransmission. The configuration option transport_lbtrm_ignore_interval
controls the length of this interval.