- Note
- The Store web monitor functionality is deprecated in favor of MCS. We do not plan to remove existing web monitor functionality, and will continue to support it in its current state. But we do not plan to enhance the web monitor in the future.
The built-in web monitor (configured in the Store configuration file) is a rich source of information about the health of a Store. This section contains a page-by-page guide to reading and interpreting the output of a UM web monitor, with just a couple example sources and one receiver using a single Store.
- Warning
- The Store's web monitor is not designed to be a highly-secure feature. Anybody with access to the network can access the web monitor pages.
Users are expected to prevent unauthorized access to the web monitor through normal firewalling methods. Users who are unable to limit access to a level consistent with their overall security needs should disable the Store web monitor (using <web-monitor>). See Webmon Security for more information.
Store Web Monitor Index Page <-
Here is an image of the Web Monitor's Index (main) page:
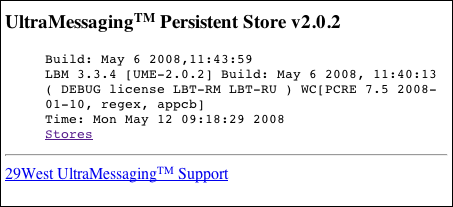
The web monitor's index page tells what build of UM is running.
The "Stores" link displays the Store Web Monitor Stores Page.
Store Web Monitor Stores Page <-
Here is an image of the Web Monitor's Stores page:
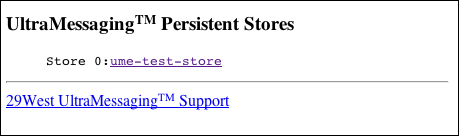
This page shows all the Stores configured under the umestored process. If you had 5 Stores configured, they would be numbered Store 0 through Store 4. Our example has only one Store configured, "ume-test-store".
Each Store name is a clickable link, which displays the Store Web Monitor Store Page for that Store.
Store Web Monitor Store Page <-
Here is an image of the Web Monitor's Store page:
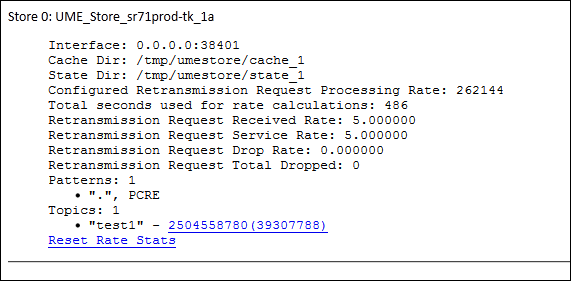
This page shows the following information about the Store.
| Item | Description |
|---|---|
| Interface | This Store is listening on all interfaces (0.0.0.0) on port 38401. |
| Cache Dir | Pathname for disk Store message cache directory. This would be configured as a Store option in the Store configuration file. For example: |
| State Dir | Pathname for disk Store state directory. This would be configured as a Store option in the Store configuration file. For example: |
| Configured Retransmission Request Processing Rate | Current value for the Store's retransmission-request-processing-rate option setting. |
| Total Seconds Used for Rate Calculations | Accumulating counter that displays the number of seconds since the last rate reset. The Web Monitor divides the Retransmission Request Received, Retransmission Request Service and Retransmission Request Drop totals by the Total Seconds to calculate the rates displayed. If you click the Reset Rate Stats, the Web Monitor resets this value to zero. |
| Retransmission Request Received Rate | Number of retransmission requests received per second. |
| Retransmission Request Service Rate | Number of retransmission requests serviced per second. |
| Retransmission Request Drop Rate | Number of retransmission requests dropped per second. Requests are dropped if the rate of retransmission requests exceeds the configured retransmission request rate. |
| Retransmission Request Total Dropped | The number of retransmission requests since the time the Store was started. |
| Patterns | Specifies the wildcard pattern used to select topics for which a Store will provide persistence services. This would be configured as a topic option in the Store configuration file. For example: <topic pattern="test.*" type="PCRE"> |
| Topics | Displays the topic names and Registration ID (Session ID) for any sources publishing on the topic. The screen examples display one topic, test1 - 2504558780(39307788). Each Registration ID (Session ID) is a clickable link, which displays the Store Web Monitor Source Page for that source. |
| Reset Rate Stats | Click the Reset Rate Stats link to reset the retransmission rates. After clicking the link, The Web Monitor rests Total Seconds Used for Rate Calculations to zero and displays a page with the Store number and the message, 'Rate Statistics have been reset'. |
Store Web Monitor Source Page <-
Here is an image of the Web Monitor's Source page:
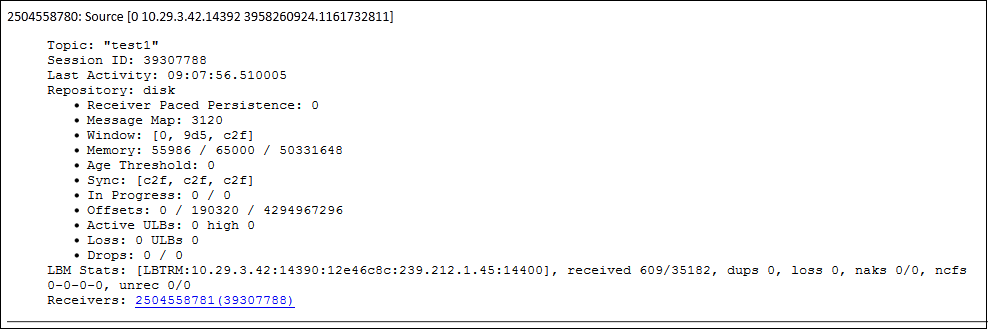
The first line in the page contains is interpreted as follows:
| 2504558780 | The source's registration ID. |
| 10.29.3.42.14392 | The IP address and port of the source's LBM configuration option, request_tcp_port (context). |
| 3958260924 | The source's transport session index. |
| 1161732811 | The source's topic index within the transport session, 3958260924. |
The remaining fields are described in the following table:
| Source Page Item | Description |
|---|---|
| Topic | test is the source's topic string. |
| Session ID | 39307788 is the source's Session ID. |
| Last Activity | 09:19:39.501350 is the timestamp when the Store last heard from the source, including keepalives sent by UM |
| Repository | disk is the type of repository. Possible values are "memory" or "disk". |
| Receiver Paced Persistence | Setting for Receiver-paced Persistence (RPP), which is a repository option both the repository and source must enable. A value of 0 means RPP is not enabled and the repository is using the default Source-paced persistence. A value of 1 means RPP is enabled. |
| Message Map: 3120 | The total number of message fragments the Store has for this source, both on disk and in memory. These are UM-level fragments, not IP-level fragments. UM messages are fragmented into roughly 8 kilobyte chunks for UDP-based protocols (LBT-RM and LBT-RU) and into roughly 64 kilobyte chunks for LBT-TCP. The majority of application messages tend to be well under the fragment boundaries, so the value after "Message Map" could be used as a rough estimate of the number of messages in the Store from this particular source. It's at least a strict upper bound. |
| Window: [0, 9d5, c2f] | Window format is: trail_sqn, mem_trail_sqn, lead_sqn
|
| Memory: 55986 / 65000 / 50331648 | Memory format is: repository memory size / repository size threshold / repository size limit
|
| Age Threshold: 0 | Age Threshold, 0, is the Store's repository-age-threshold topic option found in the Store configuration file. |
| Sync: [c2f, c2f, c2f] | Pertains to disk repositories only. Sync format is: sync_complete_sqn, sync_sqn, contig_sqn
|
| In progress: 0 / 0 | Pertains to disk repositories only. In progress format is: num_ios_pending / num_read_ios_pending
|
| Offsets: 0 / 190320 / 4294967296 | Pertains to disk repositories only. Offsets format is: start_offset, offset, max_offset
|
| Active ULBs: 0 high 0 | ULB stands for Unrecoverable Loss Burst. A little extra work is required to keep cache files consistent when the Store gets an unrecoverable loss burst, because unrecoverable loss bursts are delivered all at once for lots of messages, rather than one at a time like normal unrecoverable loss messages. |
| Loss: 0 ULBs 0 | These values are counters for number of unrecoverable loss messages (Loss) and for number of unrecoverable burst loss messages (ULB). These start at 0 when the Store starts up and aren't reset until the Store exits. They don't include any loss events that were persisted to disk from a previous run, only new loss events since the Store started. There are cases with UME 2.0 where one individual Store could legitimately report some unrecoverable loss, or maybe even unrecoverable loss bursts. |
| Drops: 0 / 0 | If the Store is nearing the repository-size-limit and gets another message, the Store will intentionally drop a message. A drop requires a bit of work on the Store's part. |
| LBM Stats | These represent transport-level statistics for the underlying receivers in the Store for the source. The example shown is for a TCP source, so not too many stats are available (stats for a TCP source are less important from a monitoring perspective). |
| Receivers | Registration IDs and accompanying Session ID for the receivers listening on the source's topic. Click on the receiver Registration ID (Session ID) to display the Store Web Monitor Receiver Page to review information about the receivers for that persisted topic. |
Store Web Monitor Receiver Page <-
Here is an image of the Web Monitor's Receiver page:
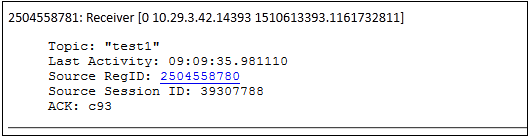
The first line in the page contains is interpreted as follows:
| 2504558781 | The receiver's registration ID. |
| 10.29.3.42.14393 | The IP address and port of the source's LBM configuration option, request_tcp_port (context). |
| 1510613393 | The receiver's transport session index. |
| 1161732811 | The source's topic index within the transport session, 1510613393. |
The remaining fields are described in the following table:
| Receiver Page Item | Description |
|---|---|
| Topic | The topic that the receiver is listening on. |
| Last Activity | 09:09:35.981110 is the timestamp of when the Store last heard from the receiver, including keepalives sent by UM. |
| Source RegID | Registration ID of the source publishing on the topic. Click on the Registration ID link to display the Store Web Monitor Source Page. |
| Source Session ID | The Session ID of the Source sending messages on the topic. |
| ACK | c93 is the last message sequence number the receiver acknowledged. |